The Overwhelm Recovery ProtocolWellness & Routines · ~5 min
About this template · Updated September 2026
Your net worth is one subtraction: everything you own, minus everything you owe. The Federal Reserve's Survey of Consumer Finances uses exactly that definition: the difference between a family's assets and its liabilities. The arithmetic takes a minute. The useful part is repeating it every month until the figures turn into a direction you can see.
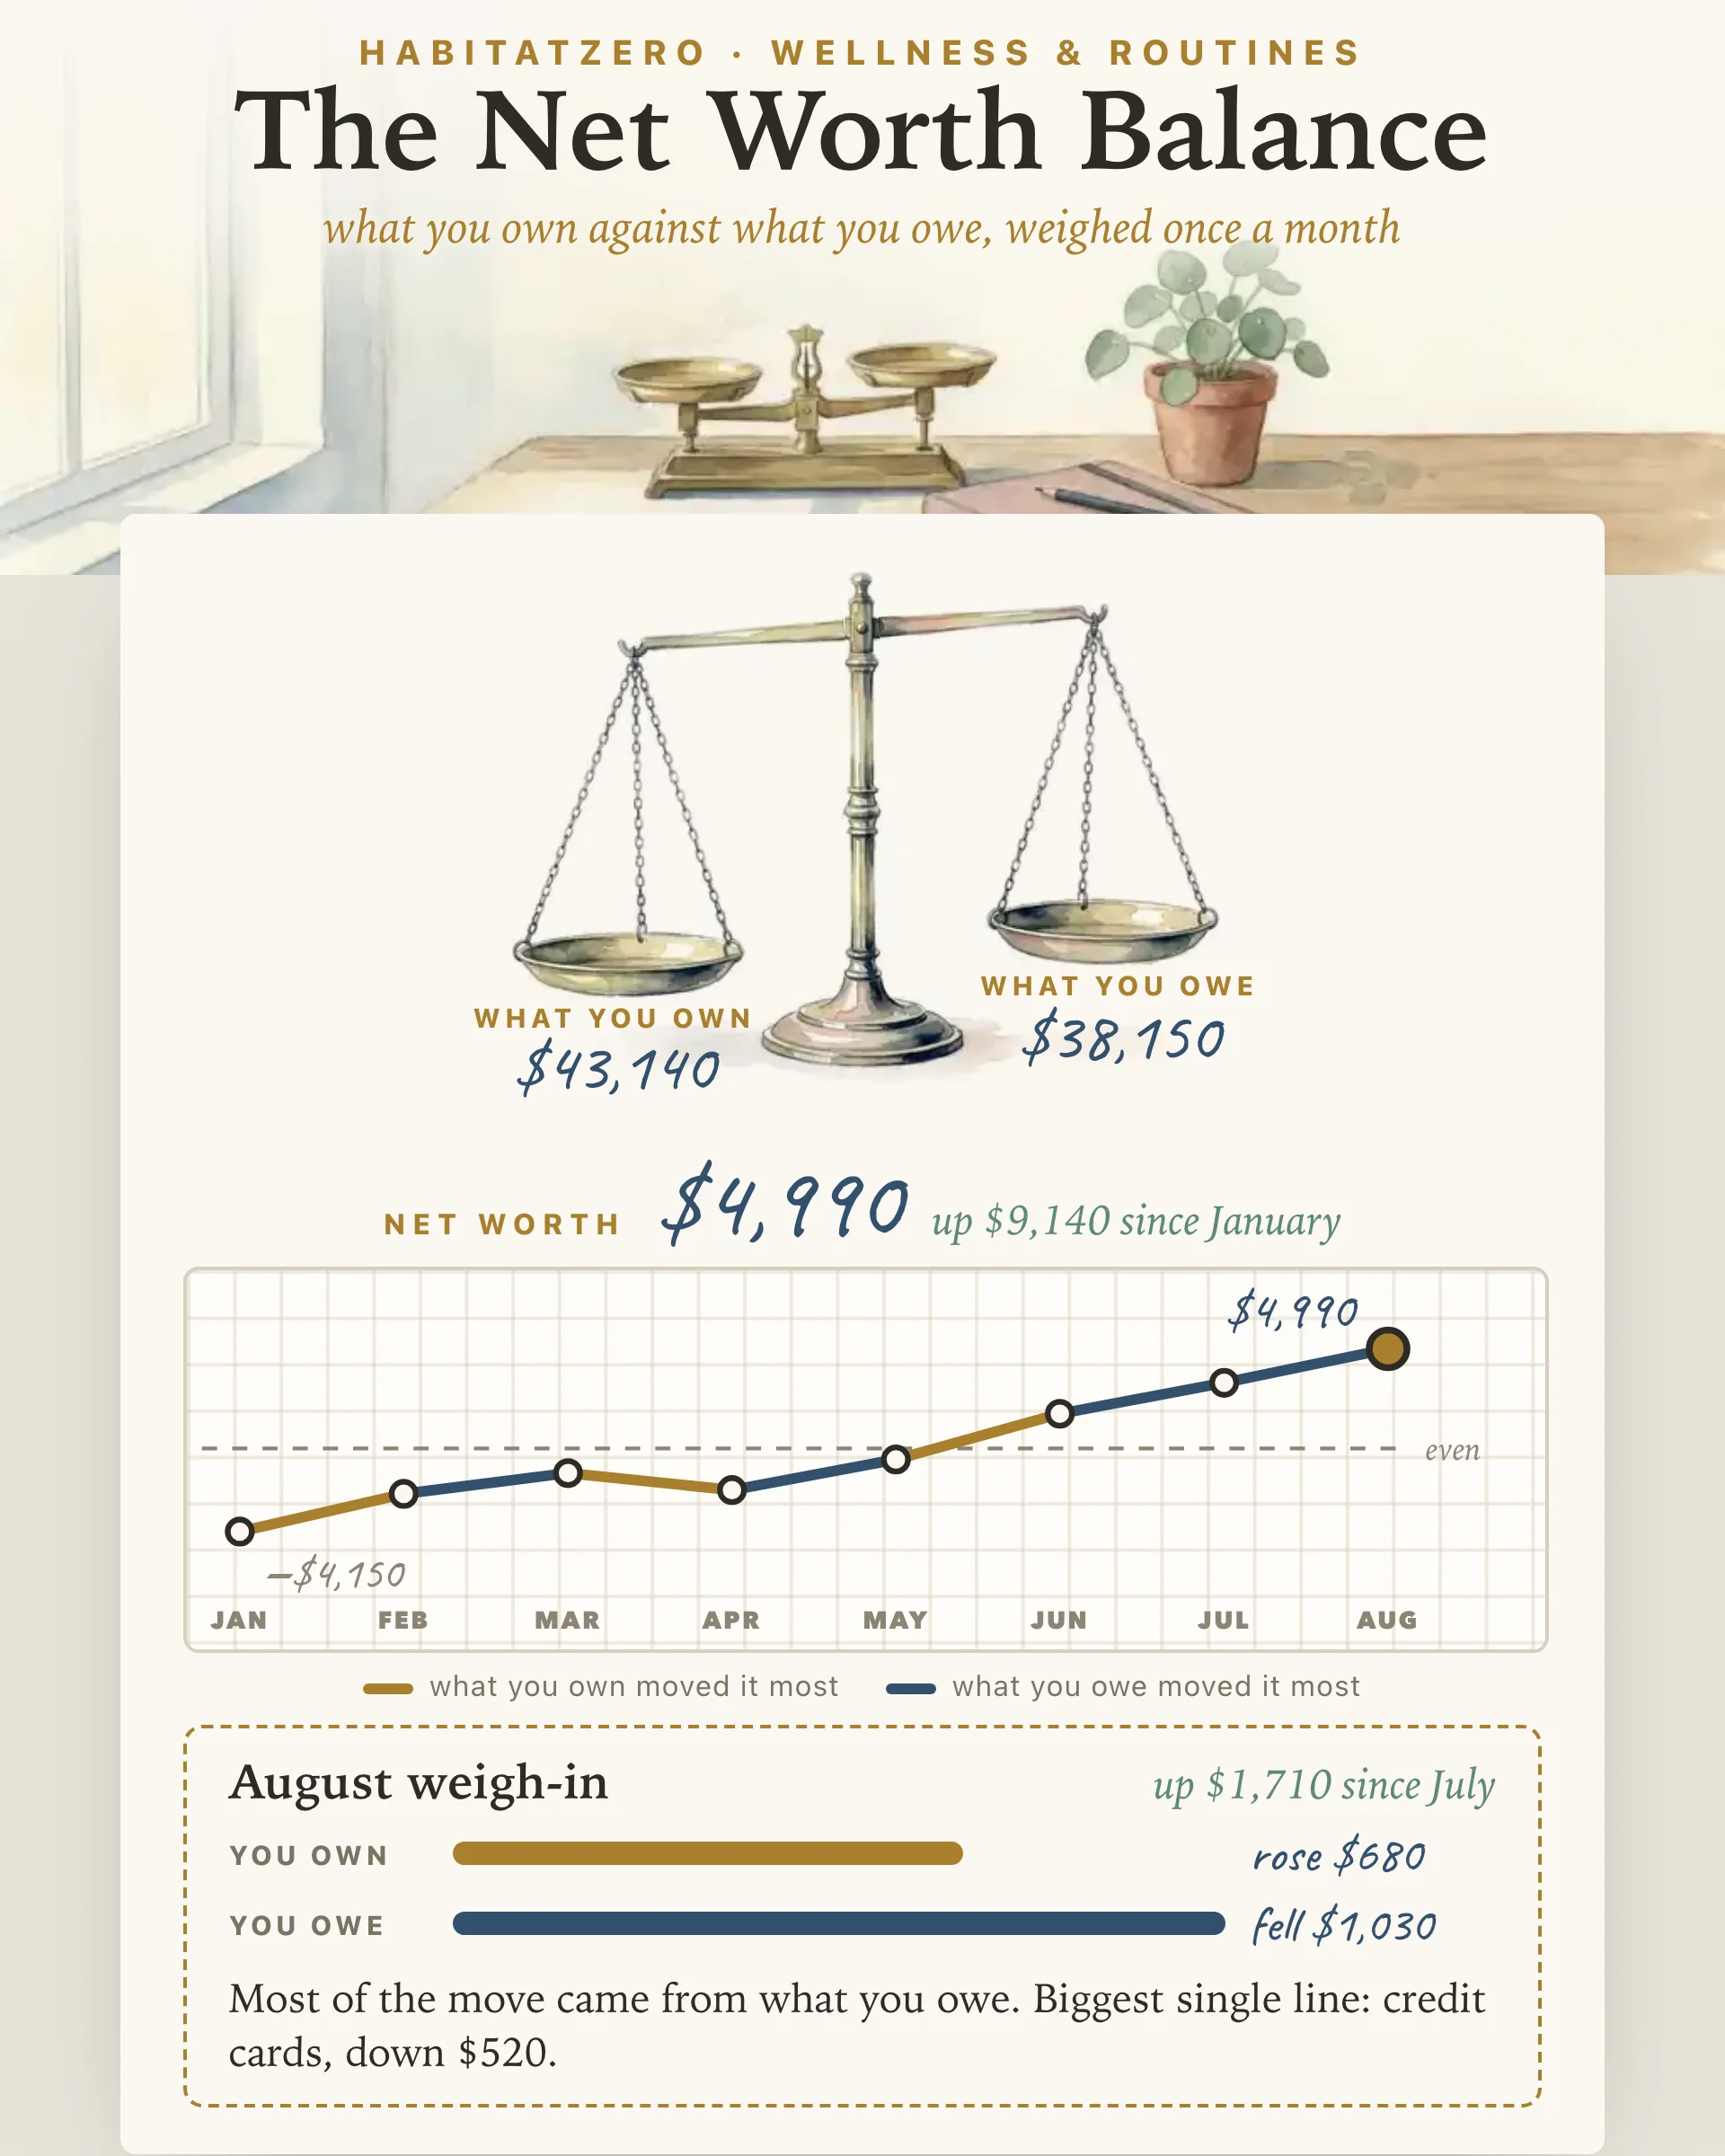
This page is built for that second part. It is a brass balance with what you own on one pan and what you owe on the other, a dated weigh-in once a month, and a line that shows not only whether your net worth rose but which side of the balance did the moving.
On the own side, list what you could turn into money: checking and cash, savings, retirement accounts such as a 401(k) or an IRA, other investments, and the price your home or car would fetch if you sold it today. Use the resale price, not what you paid. On the owe side, list the balance still owed on each debt: mortgage, car loan, student loans, credit cards, medical bills, a loan from family. Use the payoff balance, not the monthly payment.
Subtract the second total from the first. If the answer is negative, you have plenty of company. Student loans and a car loan can outweigh a young household's savings for years. A negative figure is a starting point rather than a verdict, and the line is drawn so you can watch it climb toward zero.
Tap a suggestion to put a line on a pan, or name your own, then type its figure. Round numbers are fine. Each pan holds eight lines to keep the picture readable, so fold small accounts together if you have more. As you type, the beam tips toward the heavier pan and your net worth appears underneath.
When every line has a figure, weigh in for the month. The page keeps one weigh-in per month and up to twenty-four of them, two years of history. Change a figure later in the same month and the weigh-in becomes an update instead of a duplicate. You can also step back to fill in an earlier month from old statements.
From the second weigh-in, a line appears. Each stretch of it is inked in the color of the side that moved the number most: gold when what you own did the work, ink blue when the change came from what you owe. Tap any point to read that month: the change since the weigh-in before, how much each side contributed, and the single line that moved the most. A month where your retirement account fell with the market reads very differently from one where you paid down a card, even when the net change is the same size.
Watching your progress does seem to help you reach a goal. A meta-analysis of 138 experiments with 19,951 participants found that prompting people to monitor their progress improved how often they reached their goals, and the effect was larger when the information was physically recorded or reported to someone else. Those studies covered many kinds of goals, not money in particular, so take them as a reason to write the figures down, not as a promise about your balance.
People also tend to look away from their money at the worst moments. Using daily records of investors logging in to their online accounts, one study found that logins fell 9.5 percent after market declines. A fixed weigh-in day works against that pull. You record the bad months as faithfully as the good ones, and the line stays honest.
Be careful with comparisons. The same Federal Reserve survey put the median family's net worth at $192,900 in 2022, while the mean was $1,063,700, because a relatively small number of very wealthy families pull the average far above the middle. Owning a home makes a large difference too: the median for renters was $10,400, against $396,200 for homeowners. Your own line, month over month, is a fairer yardstick than either figure.
The balance is a picture of where you stand, not financial advice. It cannot tell you whether to pay down a loan or invest the money instead, and a rising line can hide a month when cash ran short. Pair it with a plan for the money that comes in and goes out.
The figures you type stay with this worksheet. Nothing on the page connects to a bank or sends your numbers anywhere else.
Weigh in on the same day each month, such as the first weekend or the day after payday. The first weigh-in takes the longest, because you are looking up balances; after that you only change the lines that moved.
If the owe side is where you want to act, The Debt Avalanche orders your debts so each extra payment saves the most interest. To grow one line on the own side toward a target, the Savings Tracker keeps that single goal in view. And if you have not yet decided where each paycheck goes, The 50/30/20 Budget splits it three ways before the month begins.
It is a running record of everything you own minus everything you owe, taken at regular intervals. One figure is a snapshot; a year of them shows a direction, and the direction is what tells you whether your plan is working.
Add up what you own: cash, savings, retirement and investment accounts, plus what your home and car would sell for today. Subtract every balance still owed, such as a mortgage, car loan, student loans and credit cards. The answer can be negative, which is common in the first years after school.
Monthly suits most people: often enough to see a card being paid down, not so often that every market swing takes over. Keep to the same day each month so the weigh-ins compare fairly.
Count them at what they would realistically sell for now, not what you paid, and put the loans against them on the owe side. A car usually loses a little value every month, so expect that line to pull the own side down slowly.
The balance on this page is a filled-in sample to look through. To keep your own lines and watch your line grow month by month, open it in HabitatZero at no cost. Your figures stay in the worksheet and never connect to a bank.
By the team behind Fabulous, the science-based self-care app used by over 30 million people.