Reading JournalStudy & Learning · ~4 min
About this template · Updated September 2026
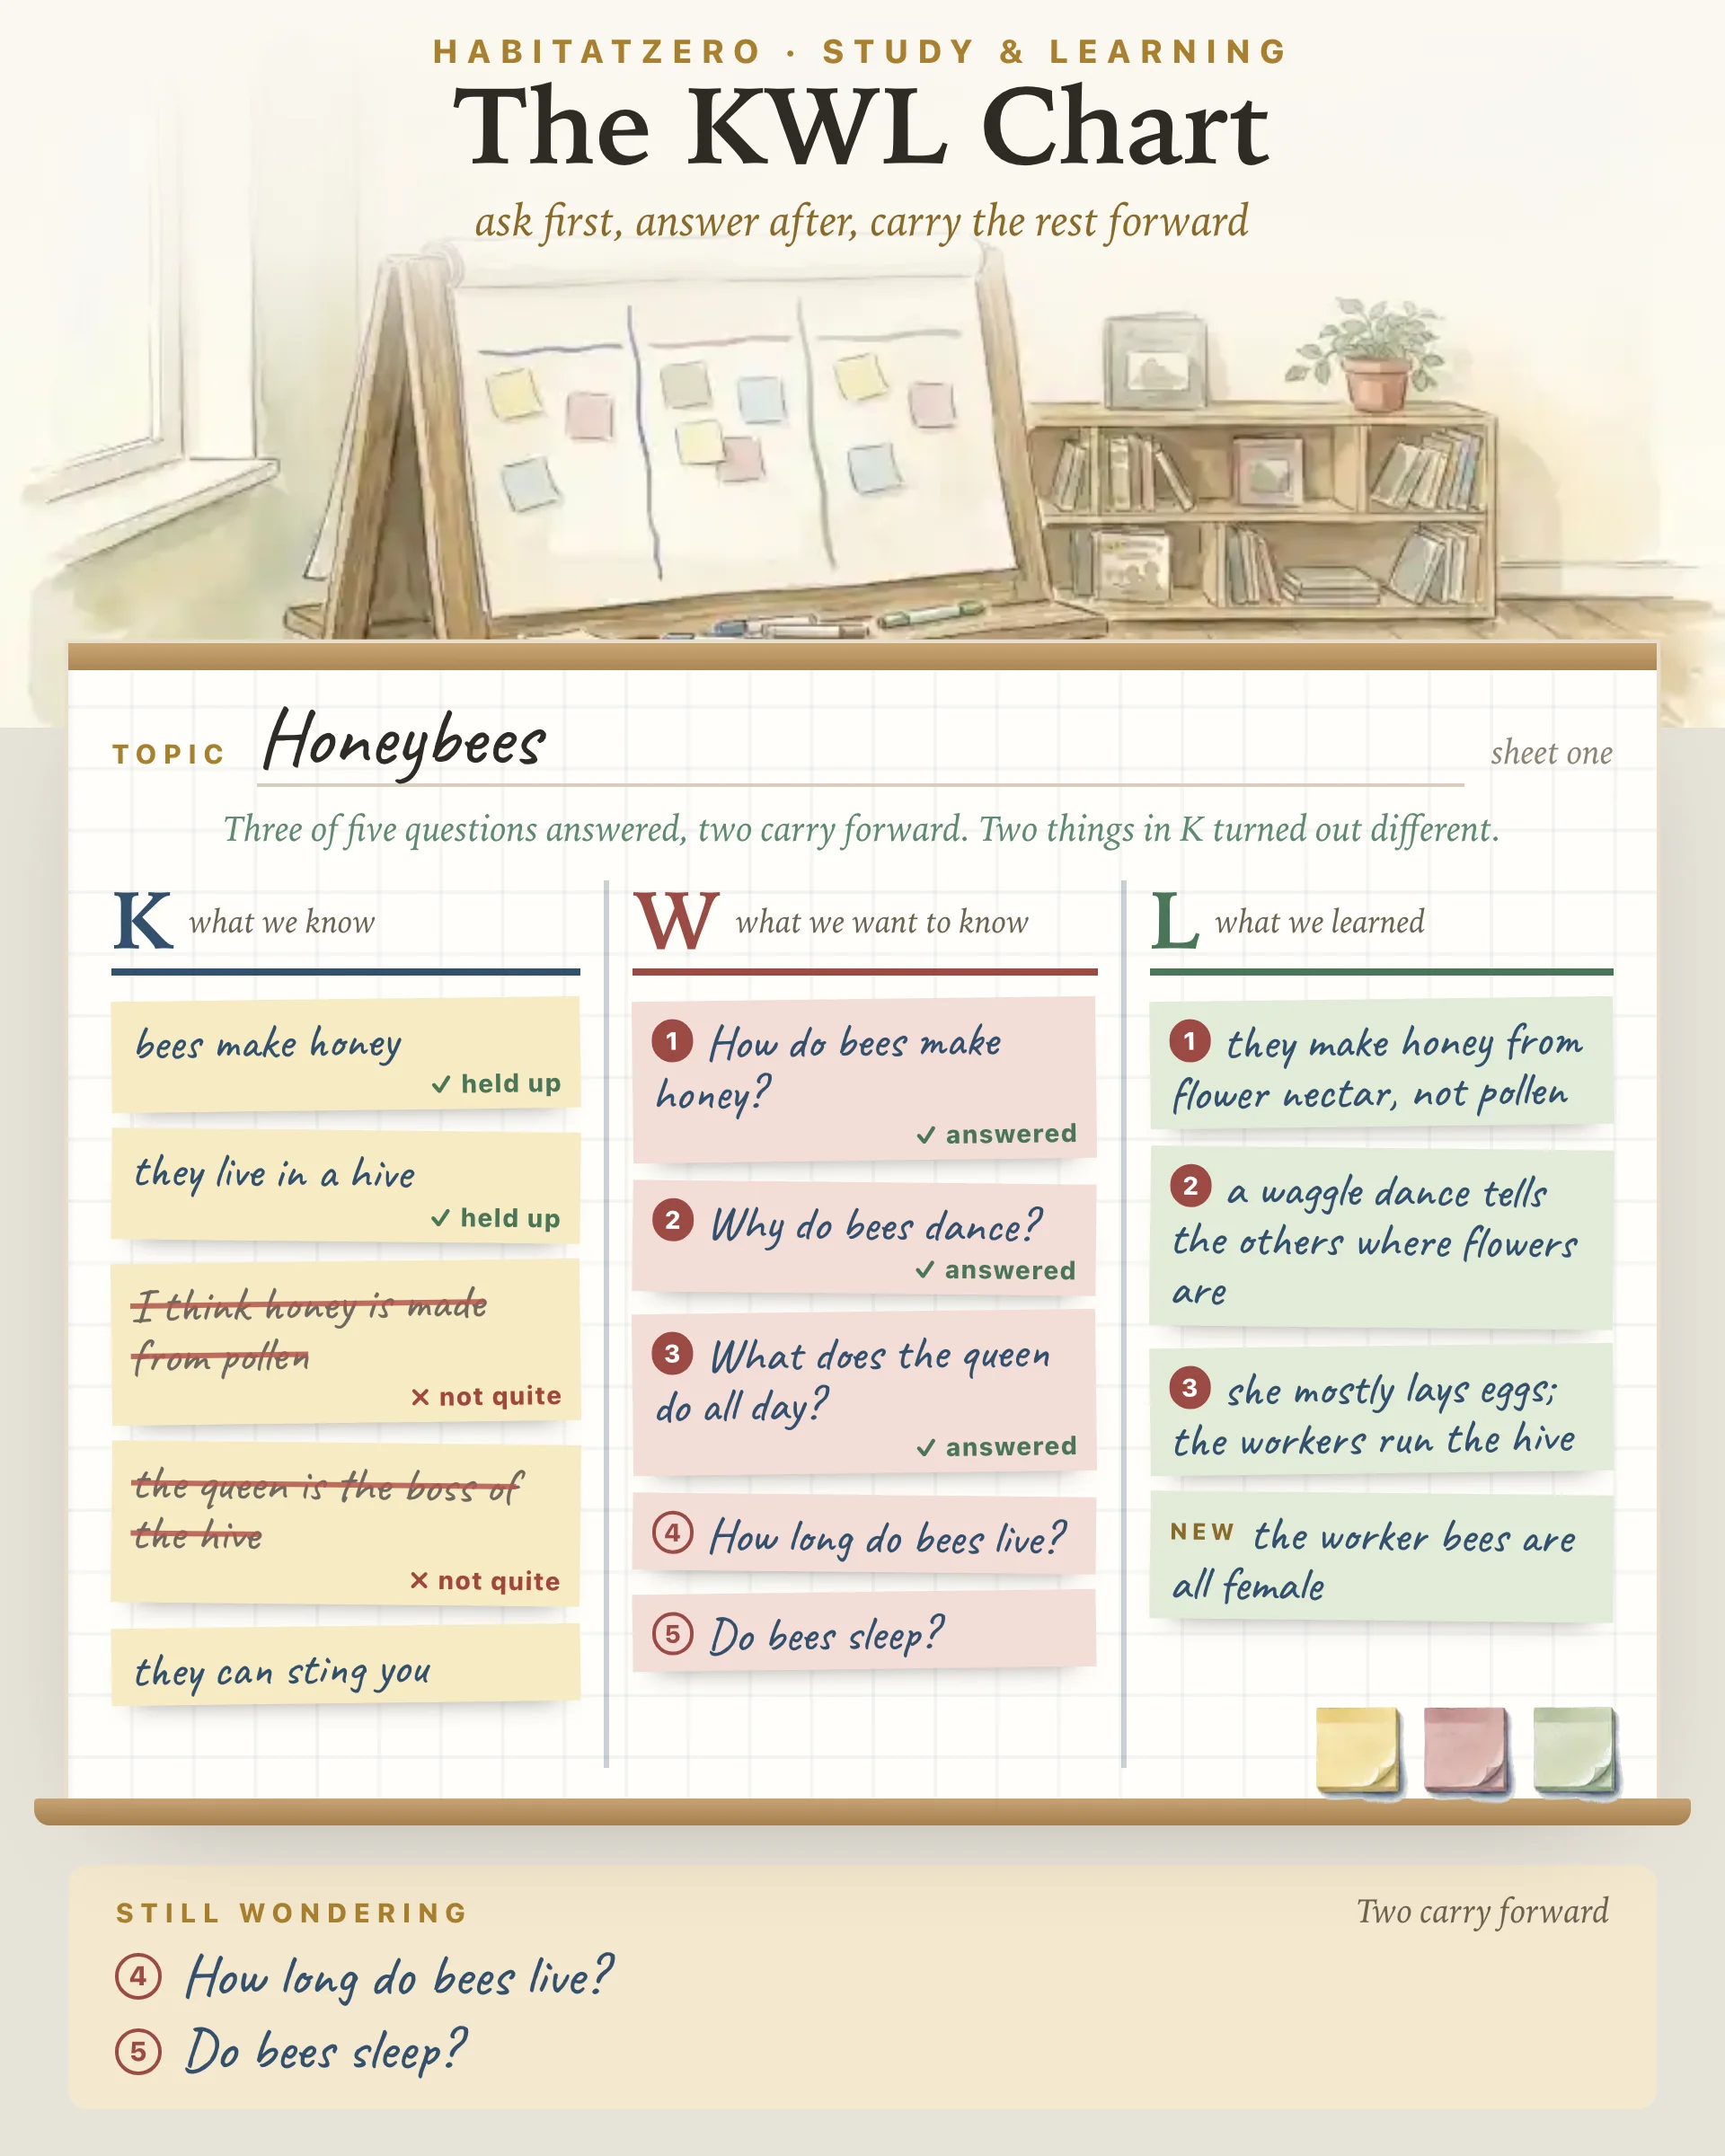
The KWL chart is Donna Ogle's. She laid it out in 1986 in The Reading Teacher as a teaching model that develops active reading of expository text: start from what children already bring to a topic, then show them how to go looking for the rest. This page is an independent worksheet for running her three columns with a class or with one child at the kitchen table. Neither Ogle nor the journal is connected to it, and neither has reviewed or endorsed it.
Kids never arrive at a topic empty. Ask a room of third graders about honeybees and you will hear that bees make honey, that they sting, and that the queen is the boss of the hive. Two of those are right. Writing all three down before anyone opens a book shows you where the class is starting, and it gives the reading a job to do.
K is what we know. Before the lesson, ask what they already know and write their words, not a tidied version. Wrong notes belong here too. A misconception on the chart is far easier to fix than one hiding in a child's head.
W is what we want to know. Turn curiosity into questions. How do bees make honey? Why do they dance? Kids read differently when they are hunting for an answer they asked for.
L is what we learned. After the reading, the video or the field trip, write what they found out, then check it against W, question by question. The questions left without an answer are worth as much as the answers.
Each column has a painted pad of sticky notes at its foot. Tap it to write a note; starters such as I think, How do and Why do help younger writers begin. A column holds eight notes and refuses a ninth, because a chart crowded past eight is hard to read from the back of the room.
Questions in W are numbered. When the reading answers one, press answer on it and write the answer in L. The note carries the question's number and the question gets a check mark. A fact nobody asked about still counts; it goes up marked new.
Once L has notes, each K note gets a mark to tap: held up or not quite. Crossing out a wrong guess in front of the kids who made it is satisfying, and the line above the chart keeps the tally: three of five questions answered, two carry forward, two things in K turned out different.
Open questions gather in a still wondering strip under the chart. When you are ready for the next round, carry them to a new sheet: what they learned becomes the new K, the open questions stay in W, and L starts empty. The page prints as a letter-size classroom sheet, blank or filled, with lines for a name and a date.
The W column rests on the firmest ground. A review of intervention studies by Rosenshine, Meister and Chapman found that teaching students to generate their own questions raised their comprehension scores on the tests that followed.
The look back at K has support of its own. A meta-analysis of interventions aimed at misconceptions in reading and science education found that the approaches that worked shared one ingredient: they made students feel the conflict between what they believed and what the evidence said. Marking a K note not quite beside the L note that corrects it is a small version of that.
Be careful with the idea that the more children know going in, the more they will learn. A large meta-analysis of domain-specific prior knowledge and learning found that what students knew before a lesson strongly predicted what they knew after it, but barely predicted how much they gained, and the effect ran in both directions across studies. Treat K as a map of the starting point, not a score.
Studies of the chart as a whole are mostly small, often one or two classes set against a comparison group. Treat it as a sensible structure built from ingredients with better evidence, rather than a proven program on its own.
Pick material that can actually answer questions: a nonfiction book, a documentary, a museum visit, an experiment. Keep a question up even when you suspect the book will skip it; the unanswered ones make the best library errands.
Ogle and Eileen Carr later added a concept map and a written summary in a version they called K-W-L Plus. A KWHL chart adds how we will find out, and a KWLS chart adds what we still want to know, the job the still wondering strip does here.
Start a chart at the opening of a unit, before a nonfiction read-aloud, or the night before a field trip, while curiosity is high. For older students heading toward a test, the L column is a ready list of what to review: turn it into cards that quiz them back in the Study Guide Builder, open The Study Techniques Cabinet to choose how to practice, and if a date is already set, let the Exam Planner spread the review across the days that remain.
It is a three-column organizer for a new topic. K holds what the learners already know, W holds what they want to know, and L holds what they learned. The first two columns get filled before a lesson or a reading, the third one after it.
Donna Ogle, a reading educator, described the K-W-L teaching model in The Reading Teacher in 1986. This page is an independent practice sheet built on her idea, with no tie to her or to the journal that published it.
A KWHL chart adds an H column for how the learners plan to find out, such as a library book, a video, an experiment or an expert. This page keeps the three classic columns and adds a strip for the questions that stay open.
They gather in a still wondering strip under the chart, the job the S does in a KWLS chart. When you start a new sheet, those open questions come along into W, and what they learned becomes the new K.
Yes. It prints as a letter-size classroom sheet with lines for a name and date, three ruled columns and a still wondering box, either blank for students to fill by hand or with your notes already on it. Keeping your own charts takes a free HabitatZero account.
By the team behind Fabulous, the science-based self-care app used by over 30 million people.