
Nutritional Biomarkers vs. Food Diaries Explained
#627: Can Nutritional Biomarkers Resolve Diet–Disease Associations? – Fumiaki Imamura, PhD
The brief
Cambridge epidemiologist Fumiaki Imamura explains why nutritional biomarkers can beat food diaries for tracking diet, but only for some nutrients. Dairy fat biomarkers track with lower type 2 diabetes risk (19:17), while objective sodium measures revealed a linear, not J-shaped, risk curve (33:41) that older self-report methods had distorted.
For decades, doctors believed that eating cholesterol made your blood cholesterol go up. It seemed obvious: you eat the stuff, it ends up in your bloodstream, it clogs your arteries. The Framingham Heart Study, the famous long-running cardiovascular research project, helped cement blood cholesterol as a powerful predictor of heart disease. But the assumption about where that blood cholesterol came from turned out to be wrong. It is synthesized within the body instead. Dietary cholesterol barely moves the number.
Cambridge epidemiologist Fumiaki Imamura uses this story to make a point about measurement itself: some things we eat leave almost no trace we can reliably read in the blood, and some things the blood tells us about have almost nothing to do with diet at all (14:52). Imamura has spent thirteen years as a senior scientist at the University of Cambridge, after a PhD in nutritional epidemiology at Tufts University and a postdoctoral stint at Harvard (05:00). His work sits at an odd intersection: half detective story, half plumbing problem. The question he keeps returning to is simple to state and hard to answer. When someone tells a researcher what they ate, how much of that report is true, and when it is not true, what else can we use instead?
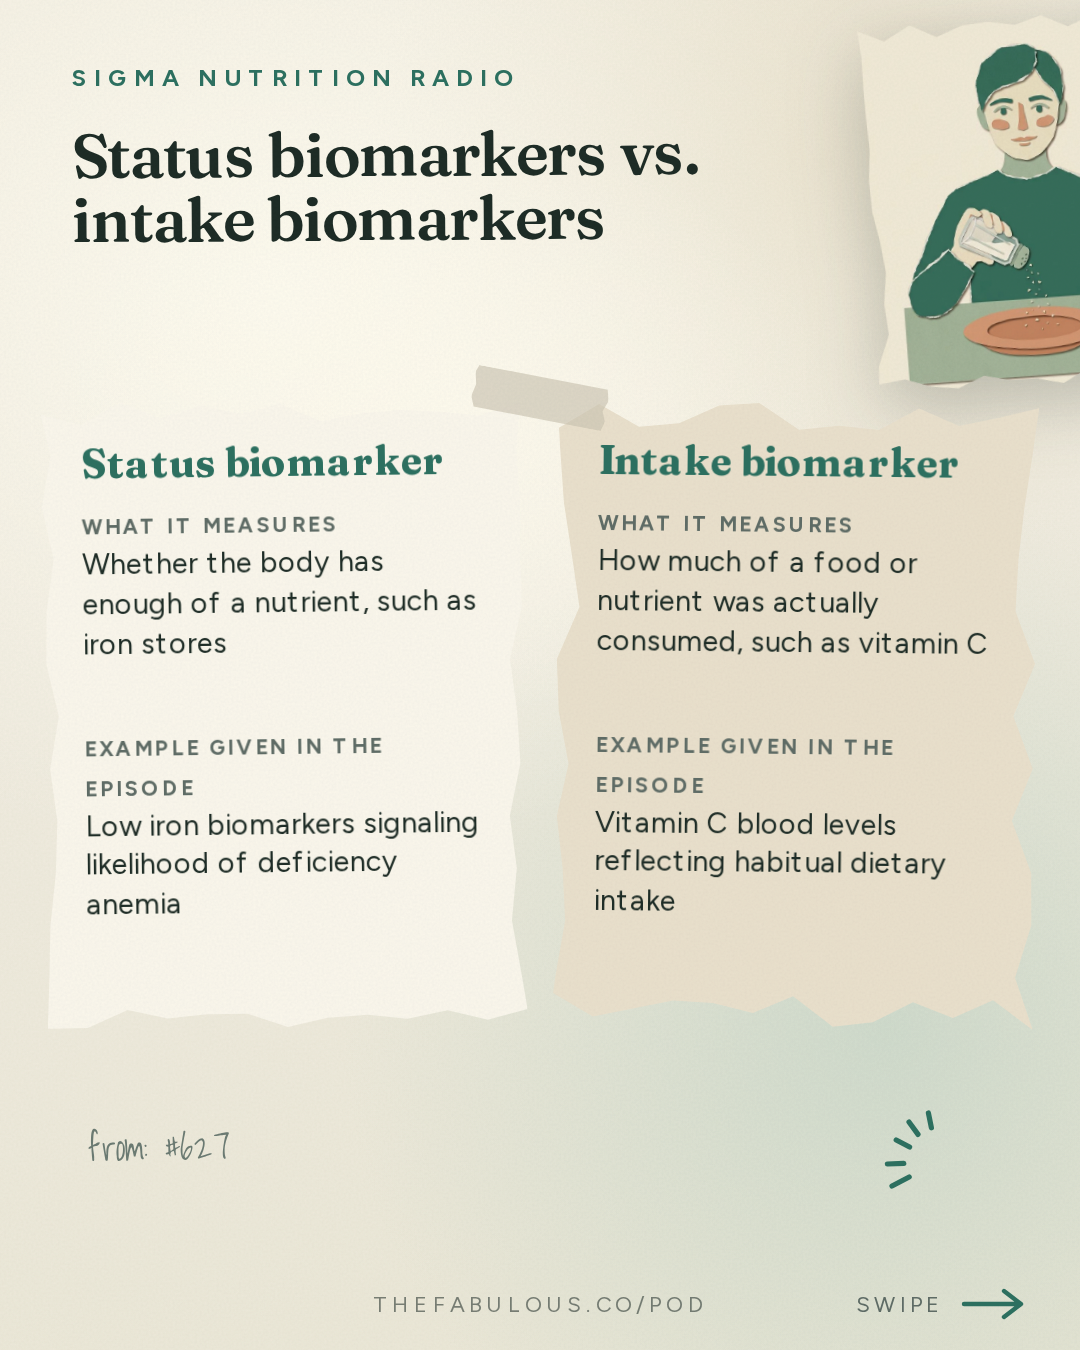
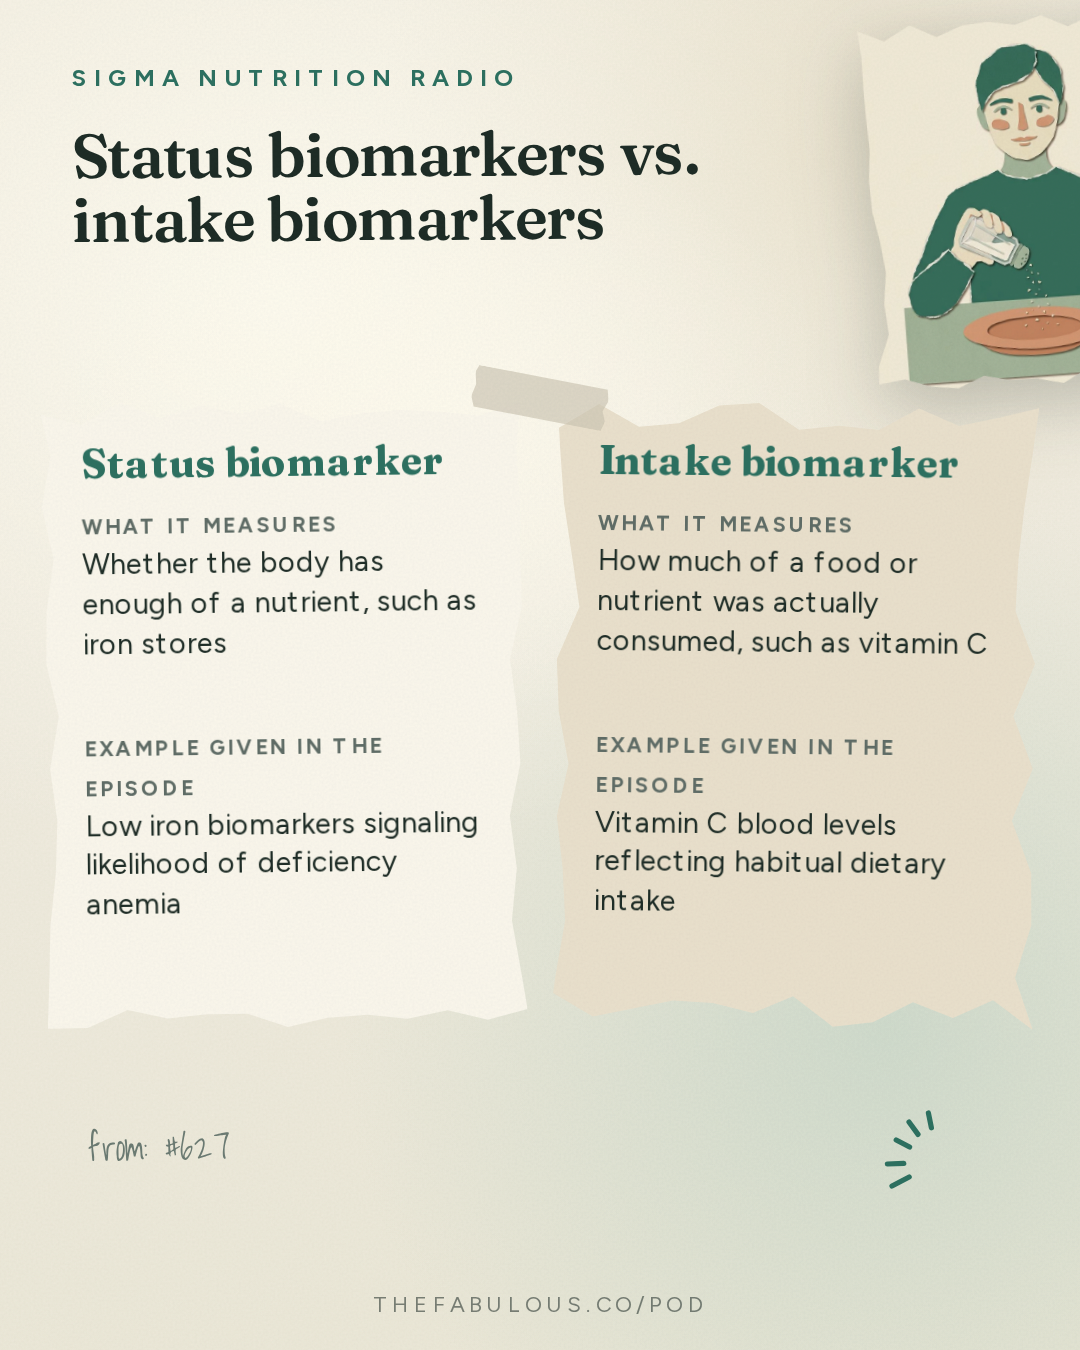
A biomarker, in the plain sense Imamura offers, is something measurable in blood, urine, hair, or fat tissue that reflects either nutritional status (do you have enough of something) or intake (how much of something you consumed) (06:10). Vitamin B12 levels can signal a deficiency. Iron levels can flag anemia risk (06:40). Those are status markers. Others, like vitamin C in the blood, can also hint at how much of a nutrient someone is actually eating (07:10). The trouble is that the same molecule can behave differently depending on where in the body you measure it. Omega-3 fatty acids in triglycerides reflect what someone ate recently, useful for checking whether a fish-oil trial worked. The same omega-3s measured in red blood cell membranes reflect years of habitual eating instead (08:44). Context decides what a number means.
This matters because self-reported diet, the food frequency questionnaires and food diaries that have powered most nutrition research, is a leaky instrument. People who weigh more tend to underreport what they eat. People who care a lot about appearing healthy tend to over-report virtuous foods and under-report everything else (11:10). For some substances, self-report barely works at all. Mercury and selenium are spread unevenly through foods such as fish, in ways no one eating a meal could estimate from memory (12:18). That is the gap biomarkers are meant to fill.
"Self-reported diet tends to involve lots of errors, but those are useful as they are. But we want to have objective measures of habitual diet." — Fumiaki Imamura [11:34]
What dairy fat in the blood says about diabetes
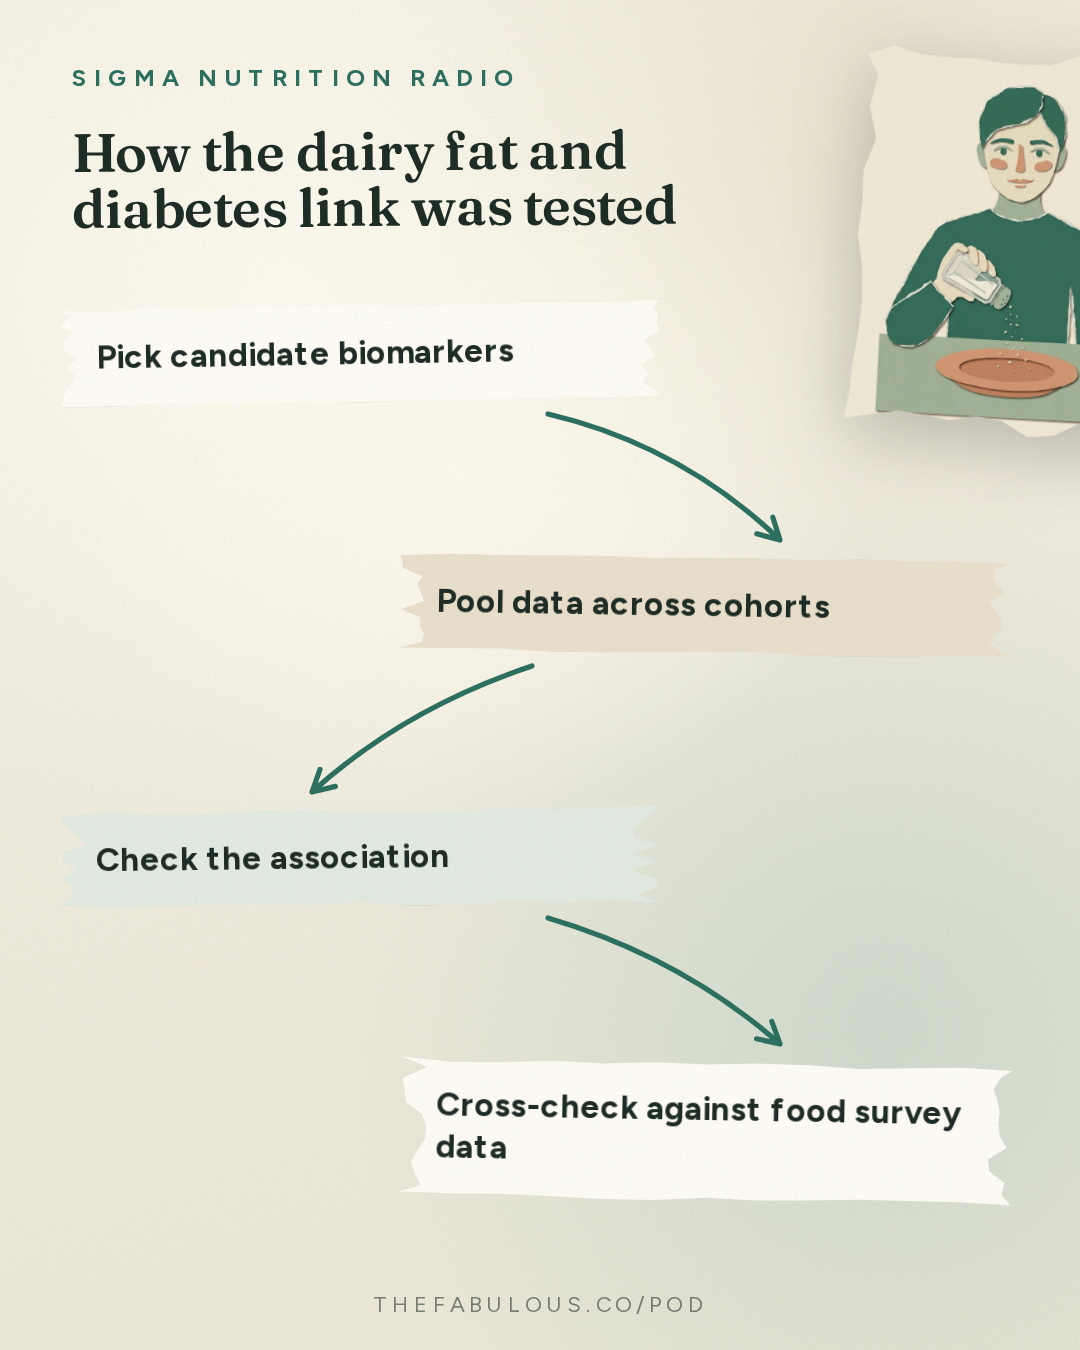
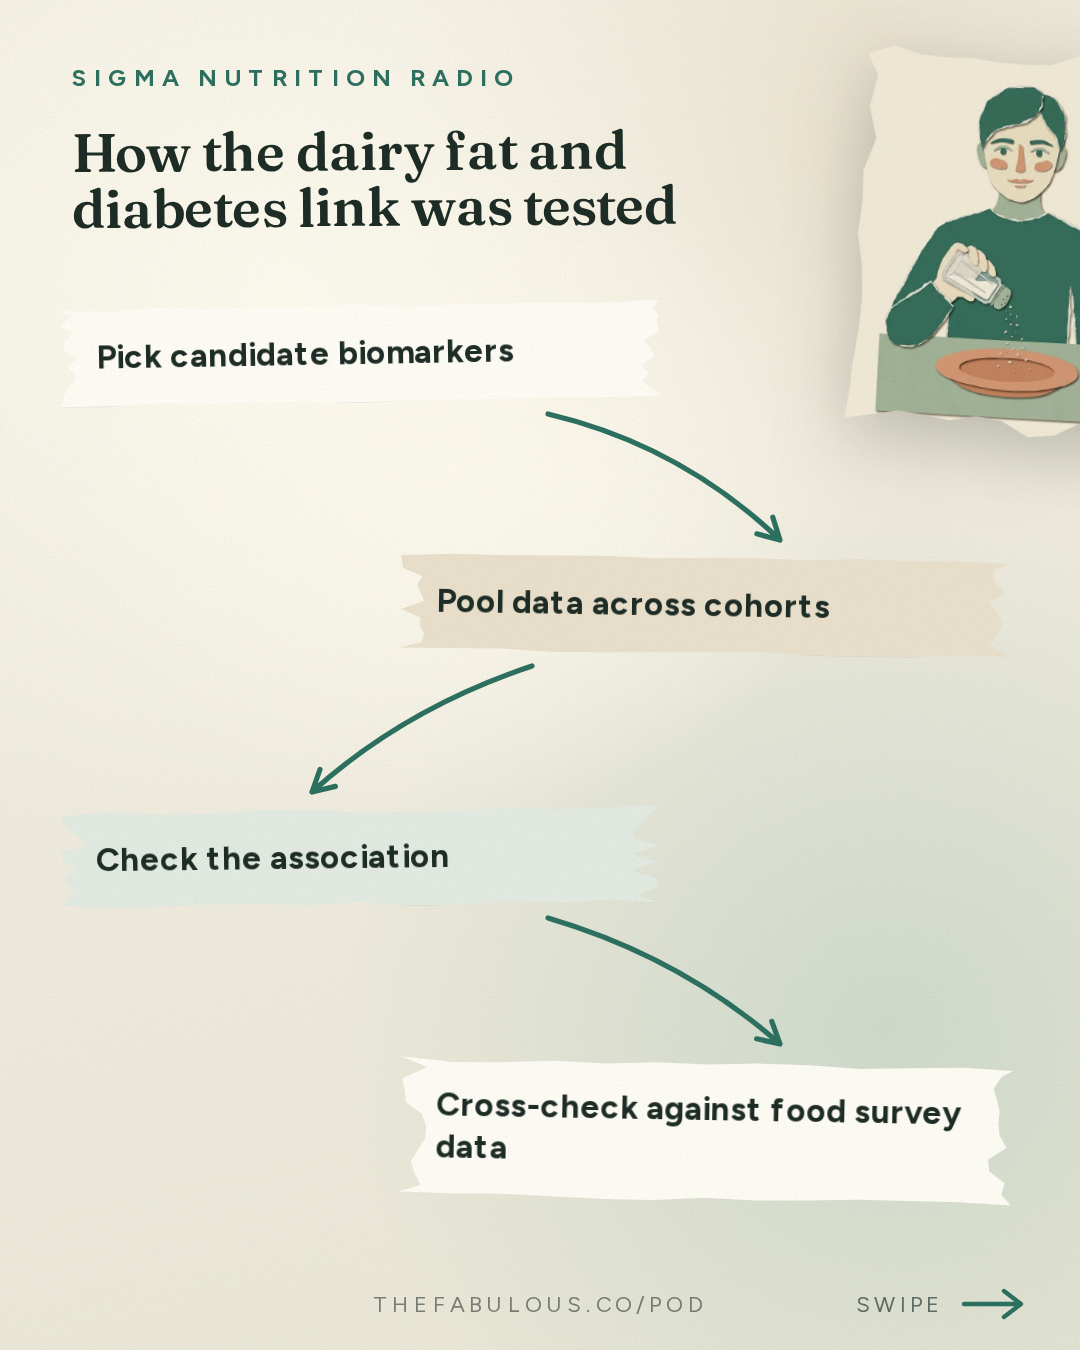
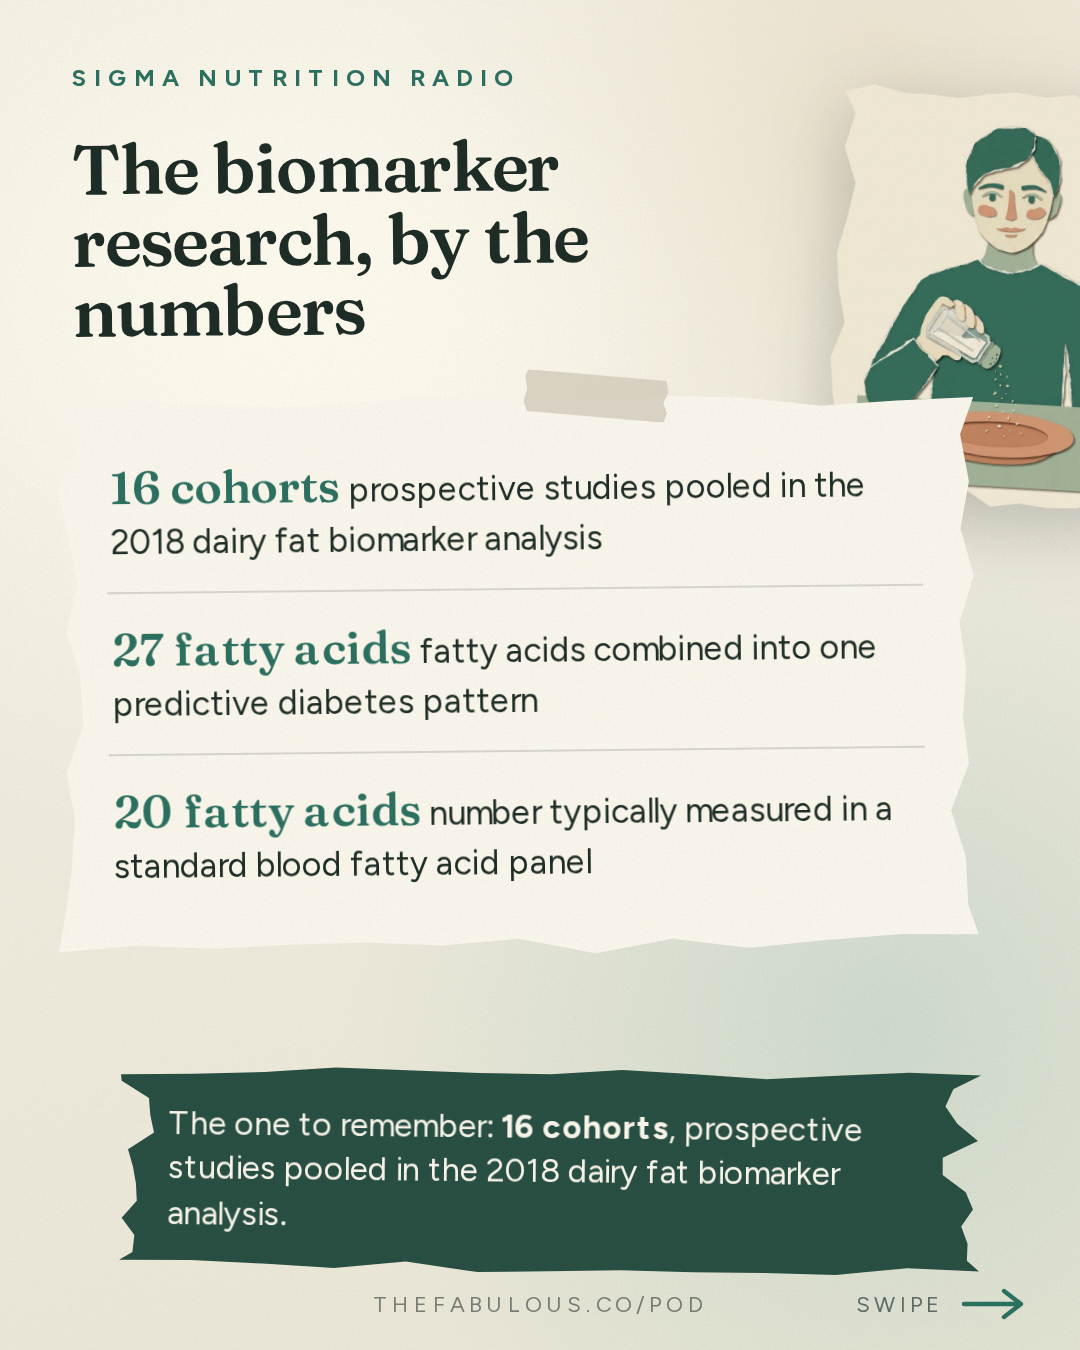
Imamura's best-known work traces a chain of evidence through dairy fat. In 2018, he and collaborators pooled data from 16 prospective cohort studies, through a project called the Fatty Acid and Outcome Research Consortium, to look at three specific blood fatty acids: the odd-chain fatty acids called 15:0 and 17:0 (molecules with 15 and 17 carbon atoms, unusual because most fatty acids the body handles have an even number of carbons), and trans-palmitoleic acid. All three are believed to come mainly from dairy fat (18:10, 18:45). People with higher levels of these biomarkers had lower rates of developing type 2 diabetes over follow-up (19:17).
"We found the negative association of higher concentration of those biomarkers, and incidence of type 2 diabetes." — Fumiaki Imamura [19:17]
What makes this more convincing than a single study is how it lines up with separate, self-reported data. Meta-analyses of food-based surveys had already found that yogurt, cheese, and fermented dairy were linked to lower type 2 diabetes risk. More surprisingly, so were ice cream and butter, foods nobody would call health foods (20:26). Imamura treats this as evidence against the obvious objection, that the association is just picking up healthy lifestyle habits in disguise. If ice cream eaters were simply healthier people overall, you would expect sherbet, a similar frozen dessert without dairy fat, to show the same protective pattern. It does not (21:05). The biomarker and the food-survey evidence converge on dairy fat itself, not on the kind of person who eats it.
A later 2020 analysis from the same consortium added a complication. Certain fatty acids the body makes on its own, through a process called de novo lipogenesis (literally, new fat creation), were also linked to higher diabetes incidence. Imamura is careful about what this does and does not show. It does not prove that making more fat causes diabetes. It might instead be a marker of an already-developing metabolic problem, or even part of the body's attempt to protect the pancreas from damage (23:54, 24:53). An association found through a very clean biomarker is still just an association. The biochemistry has to catch up to explain why it exists.
That caution extends to a broader method Imamura has used: instead of looking at one fatty acid at a time, combine many into a single pattern. In an analysis using the EPIC-Interact cohort (a large European study of diet and metabolic disease), he combined 27 different fatty acids into one composite score and found it predicted type 2 diabetes more strongly than any individual fatty acid did (26:15). The logic mirrors dietary pattern research, like the Mediterranean diet literature, where combinations of foods often predict health outcomes better than any single food does, because real diets are not eaten one nutrient at a time (27:21, 27:59). The cost of that power is specificity. A strong pattern cannot tell a clinician which single change, more olive oil, less red meat, would move the needle. You gain predictive strength and lose actionable detail.
The sodium problem, solved twice
If dairy fat shows biomarkers at their most persuasive, sodium shows them at their most necessary, and also their most incomplete. Sodium is present almost everywhere in food, which makes it nearly impossible to estimate accurately by asking people what they ate (33:16). The standard workaround is a 24-hour urinary sodium collection, treated as the gold standard measure and used by the Global Burden of Disease Project to estimate how much sodium contributes to disease worldwide (32:46).
That objective measure changed the scientific picture. Older studies, relying on weaker sodium measures, had produced a J-shaped curve: risk rose at very low sodium intake as well as at high intake, which made some researchers wary of aggressive sodium reduction. Once repeated, objective urinary sodium measurements replaced the older data, the relationship looked closer to a straight line of rising risk with rising intake, suggesting the J-shape was largely a measurement artifact rather than a biological reality (33:41). Even here, Imamura flags a catch: in populations with very high physical activity and heavy sweating, such as farming communities in parts of China, urinary sodium stops being a reliable stand-in for intake, because sweat removes sodium the urine test cannot capture (34:10).
The sharpest illustration of what biomarkers cannot do comes from a large cluster-randomized trial in China, published in the New England Journal of Medicine, which tested salt substitutes for stroke prevention and succeeded (36:10). That trial worked, Imamura explains, because roughly 80% of sodium in the Chinese diet studied comes from cooking or table salt added at home, a fact that could only be established through dietary records, not blood or urine tests (36:30). In the United Kingdom, where Imamura now works, the single biggest source of dietary sodium is bread (37:00). A biomarker can tell you how much sodium is in someone's body. It cannot tell you whether that sodium came from a saltshaker or a sandwich. For that, you still need people to report what they ate.
"Biomarkers are powerful, but dietary assessment is definitely critical to consider what interventions needed, knowing how people consume certain dietary factors." — Fumiaki Imamura [37:18]
That is the real shape of Imamura's argument, and it resists the simple version where objective measurement always beats self-report. Biomarkers are better at answering the question of how much. Food records remain better at answering the question of from where. Public health interventions, salt substitutes, dietary counseling, food reformulation, depend on both answers at once. The blood cholesterol story that opened this piece is itself a reminder of the same lesson in reverse: a measurement being accurate and objective does not guarantee it is measuring what a question actually needs answered. Good nutrition science, on Imamura's account, is less about finding the one tool that replaces guesswork and more about knowing which tool answers which question, and admitting, out loud, which questions neither tool can answer yet.
Ask this episode anything
Pod's AI answers from the episode itself, with the minute mark so you can hear it yourself.
Or start with one of these
Ask this episode
Pod's AI listens to the whole episode to answer, and points you to the minute it comes from.
The rest of this answer, and any question after it
Answers come from the episode itself, never from a summary of it.
ContinueKey takeaways
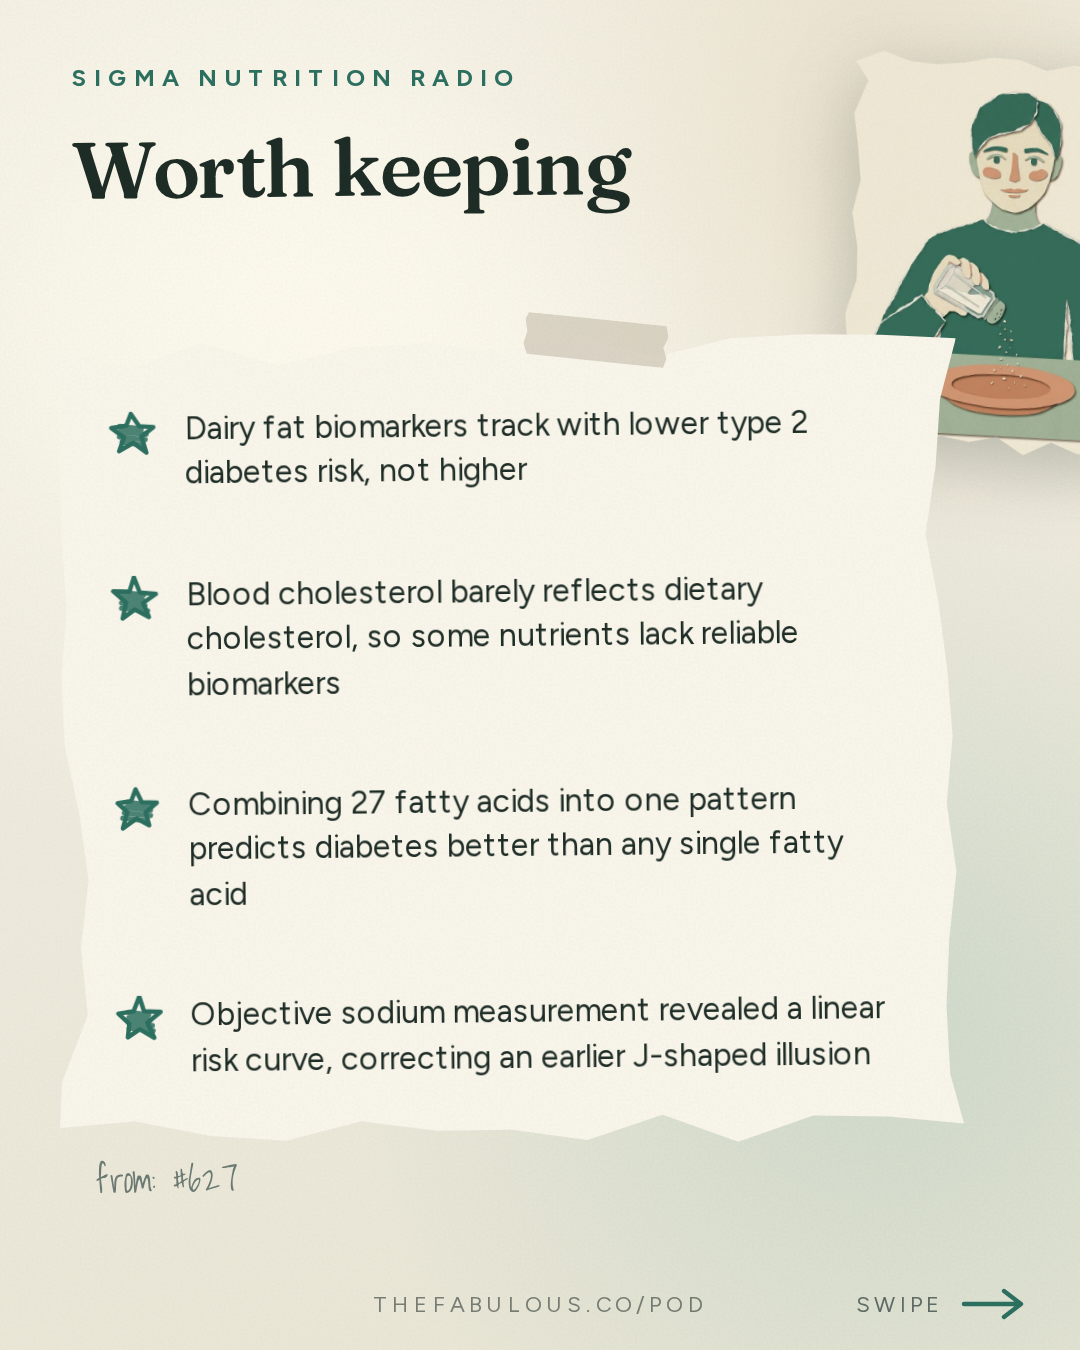
- Dairy fat biomarkers track with lower type 2 diabetes risk, not higher
- Blood cholesterol barely reflects dietary cholesterol, so some nutrients lack reliable biomarkers
- Combining 27 fatty acids into one pattern predicts diabetes better than any single fatty acid
- Objective sodium measurement revealed a linear risk curve, correcting an earlier J-shaped illusion
- Biomarkers show how much sodium is in the body but not where it came from, so diet records still matter
The episode in cards

By the numbers
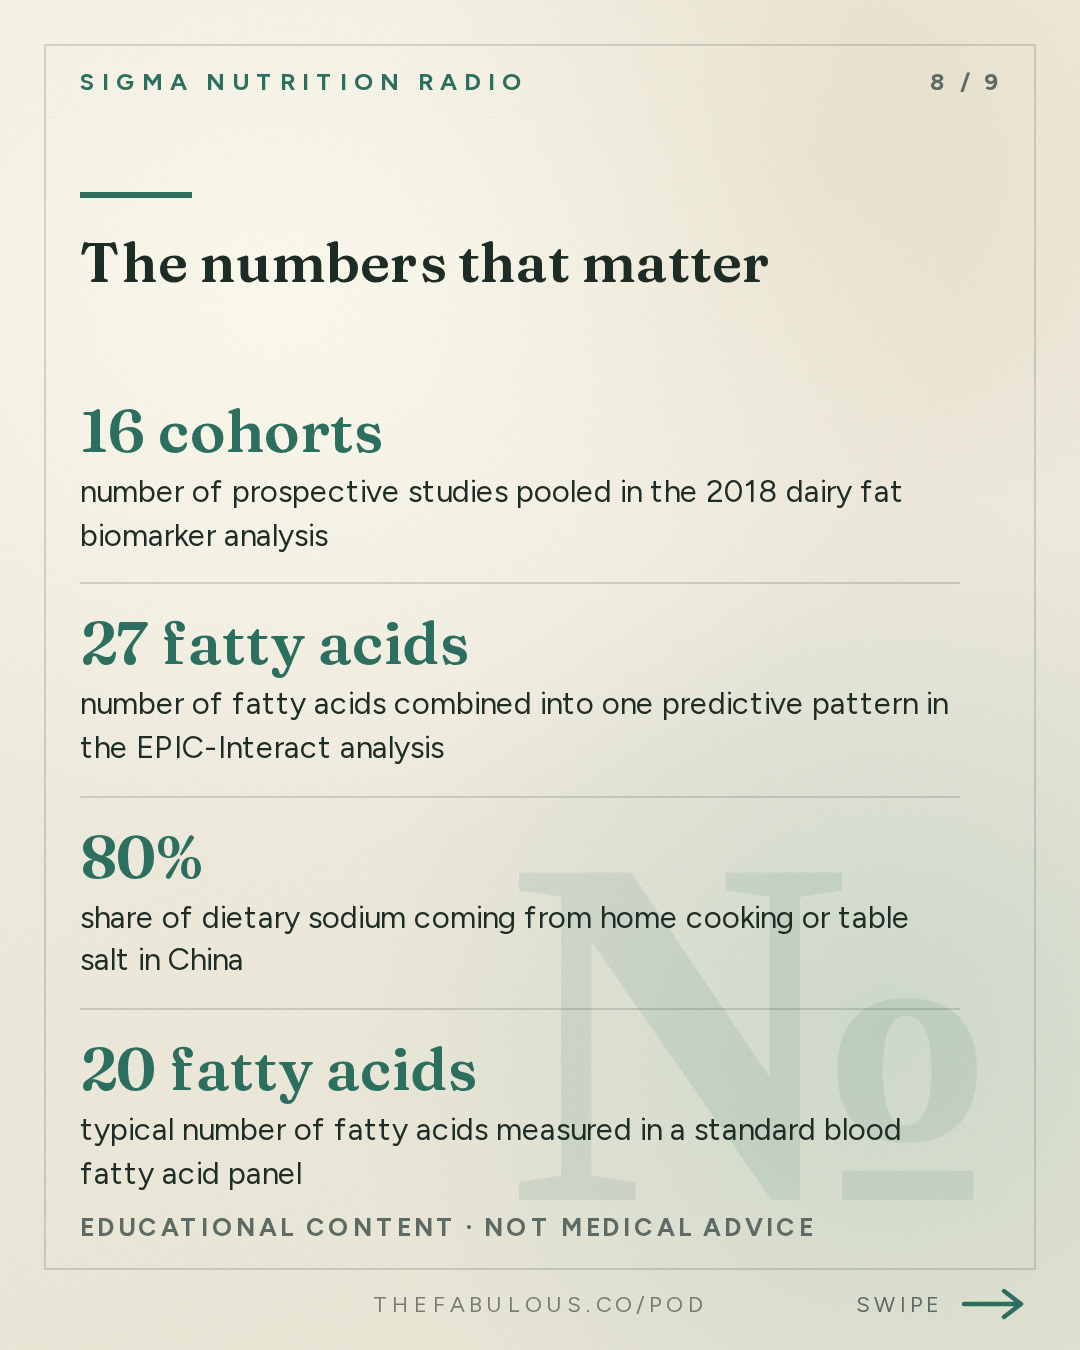
- 16 cohorts number of prospective studies pooled in the 2018 dairy fat biomarker analysis
- 27 fatty acids number of fatty acids combined into one predictive pattern in the EPIC-Interact analysis
- 80% percent share of dietary sodium coming from home cooking or table salt in China
- 20 fatty acids typical number of fatty acids measured in a standard blood fatty acid panel
In their words
“Self-reported diet tends to involve lots of errors, but those are useful as they are. But we want to have objective measures of habitual diet.”
“Blood cholesterol isn't very much influenced by dietary cholesterol. So some diet intakes do not have corresponding biomarkers”
“We found the negative association of higher concentration of biomed, those biomarkers, and incidence of type 2 diabetes”
“Biomarkers are powerful, but dietary assessment is definitely critical to consider what interventions needed, knowing what, how people consume certain dietary factors”
Protocols
-
Measuring true sodium intake in research
Researchers use a 24-hour urinary sodium collection as the gold-standard method for assessing population sodium intake, because self-reported surveys cannot accurately capture how much salt people actually consume. This method underlies the Global Burden of Disease Project's estimates of sodium-related health risk.
A single full 24-hour urine collection per assessment
Questions this episode answers
Are nutritional biomarkers more accurate than food diaries?
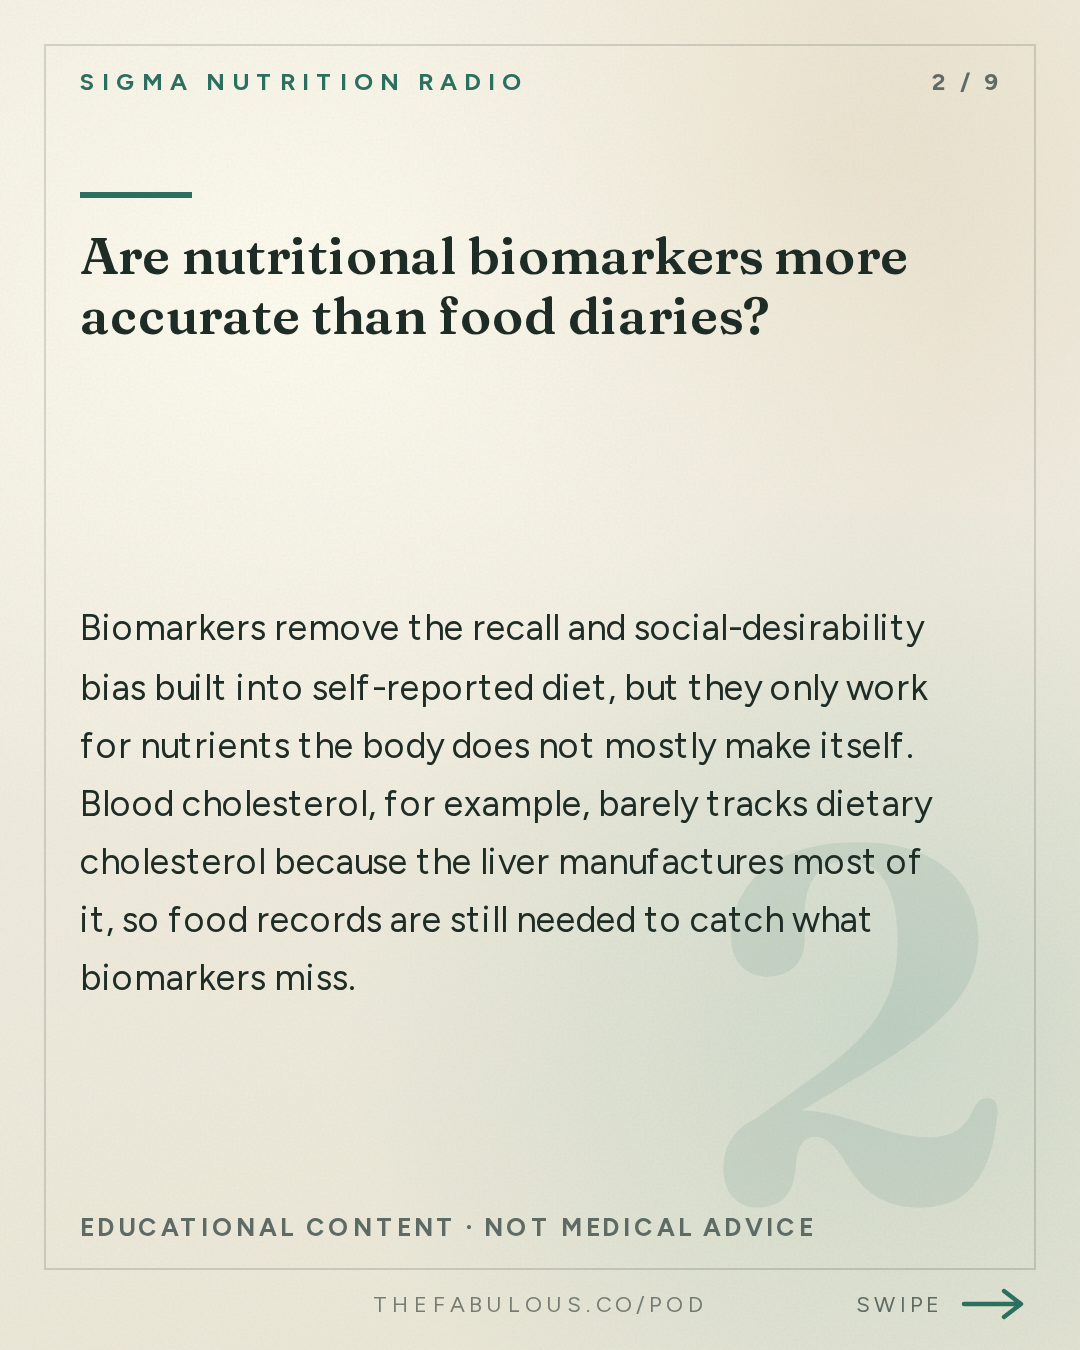
Biomarkers remove the recall and social-desirability bias built into self-reported diet, but they only work for nutrients the body does not mostly make itself. Blood cholesterol, for example, barely tracks dietary cholesterol because the liver manufactures most of it (14:52), so food records are still needed to catch what biomarkers miss.
Does dairy fat raise or lower type 2 diabetes risk?
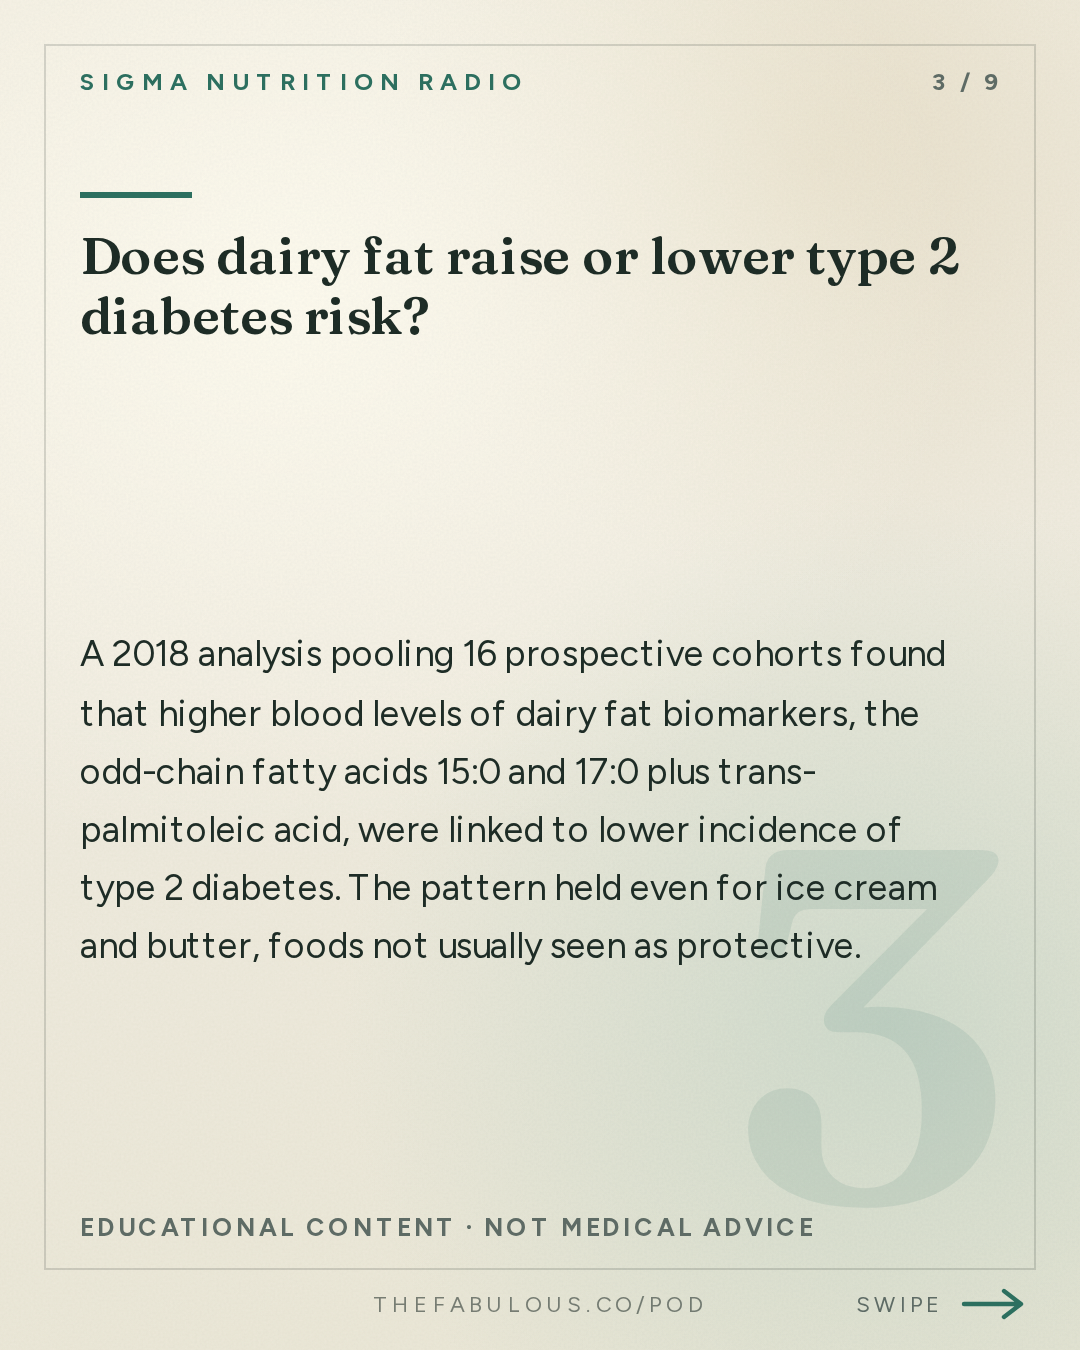
A 2018 analysis pooling 16 prospective cohorts found that higher blood levels of dairy fat biomarkers, the odd-chain fatty acids 15:0 and 17:0 plus trans-palmitoleic acid, were linked to lower incidence of type 2 diabetes (19:17). The pattern held even for ice cream and butter, foods not usually seen as protective (20:26).
What is the gold-standard biomarker for sodium intake?
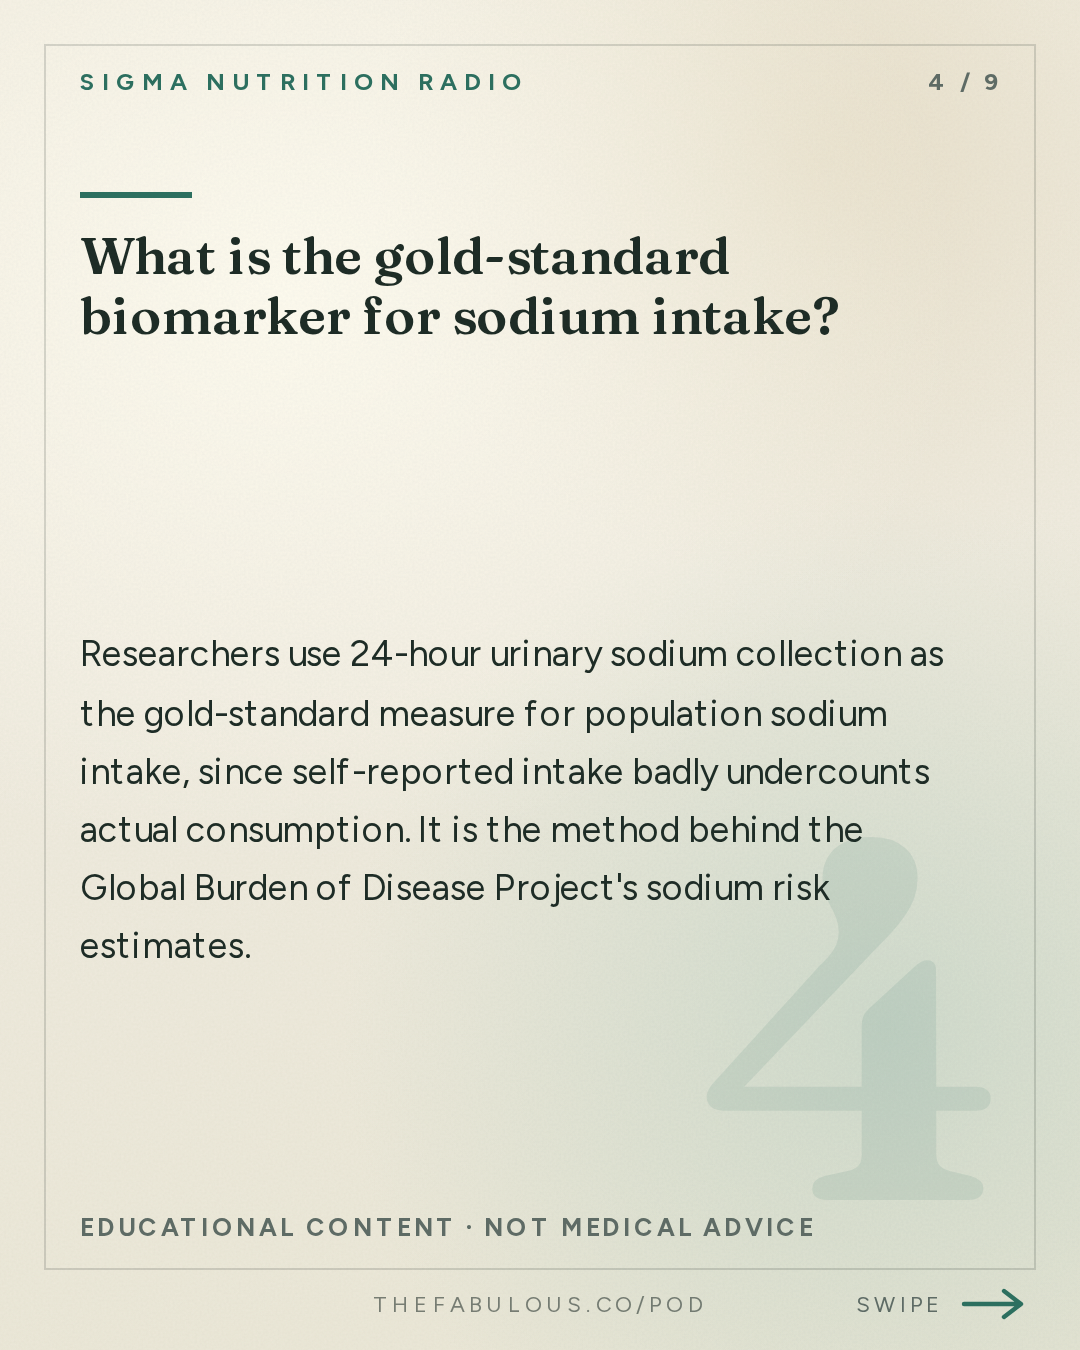
Researchers use 24-hour urinary sodium collection as the gold-standard measure for population sodium intake, since self-reported intake badly undercounts actual consumption (32:46). It is the method behind the Global Burden of Disease Project's sodium risk estimates.
Why did the sodium-risk curve look J-shaped in older studies?
Earlier research using weaker sodium measures produced a J-shaped curve, showing elevated risk at both very low and very high sodium levels. Once objective, repeated urinary sodium biomarkers replaced those weaker measures, the relationship looked closer to linear, suggesting the J-shape was a measurement artifact (33:41).
Can biomarkers replace dietary questionnaires entirely?
No. Cambridge epidemiologist Fumiaki Imamura argues biomarkers show how much sodium is in the body but not where it came from, so a UK sodium-reduction strategy needs to target bread, the country's top sodium source, while China's strategy targets table salt, which supplies about 80% of sodium there (36:30, 37:00). Both tools are needed together.
The full read, in cards
Go deeper
- Framingham Heart Study — Long-running cohort that established blood cholesterol as a predictor of coronary heart disease, later shown not to track dietary cholesterol closely
- 2018 Fatty Acid and Outcome Research Consortium (FAORC) dairy fat analysis — Pooled 16 prospective cohorts and found dairy fat biomarkers inversely associated with type 2 diabetes incidence
- EPIC-Interact fatty acid pattern analysis — Combined 27 fatty acids into one pattern that predicted type 2 diabetes more strongly than single fatty acids
- China salt substitute cluster-randomized trial (New England Journal of Medicine) — Found salt substitution reduced stroke risk, effective because most sodium in the study population came from home cooking
Mentioned
Fumiaki Imamura · University of Cambridge · Harvard School of Public Health · Tufts University · Framingham Heart Study · EPIC-Interact · New England Journal of Medicine · Global Burden of Disease Project
More from this show and category
Diet for Healthy Aging: Protein, B12, and Bone Health
The US gap between lifespan and healthspan has widened to 14 years, and physician-researcher Charlyn Black argues most of that decline is modifiable, not biological. She covers why aging muscle resists protein, why B12 and calcium absorption falter after 50, and why atherosclerosis often starts by age 20 (08:38, 15:14, 24:47).
Micronutrients for Anxiety and Depression
Nutrition and mental health trials only prove a supplement works if contact time, baseline severity, and outcome measures are controlled for. The 2023 NOMAD-RCT tested this by giving matched minimal contact to both groups and measuring medication-free adults with the PHQ-9 and GAD-7, isolating whether a micronutrient formula alone affects anxiety and depression.
Harry Sokol on Gut Microbiome and Health
Gastroenterologist Harry Sokol says science still can't define a healthy gut microbiome. Fecal transplants cure 80-90% of recurrent C. difficile infections but only 30-35% of ulcerative colitis cases, the Mediterranean diet remains the best-evidenced prevention strategy, and current consumer microbiome tests lack reproducibility and clinical use.
Plant-Based Diets for Athletes and Sustainability
Elite sports nutritionist Pieter Res says athletes can shift toward plant protein for sustainability without losing performance or muscle growth. Research from the Van Loon lab shows 30 grams of combined plant protein per meal matches whey's muscle protein synthesis ceiling (17:31), and cutting beef remains the single biggest lever for reducing diet's environmental impact (08:49).
